In the ever-evolving world of web development, staying ahead of the curve is crucial. Have you ever wondered how top developers debug, edit, and optimize their websites in real-time? The answer lies in the powerful, yet often underutilized, Chrome Developer Tools. According to a 2022 survey, 68% of developers rely on Chrome DevTools for their everyday development tasks. With millions of websites competing for attention, it’s no wonder that mastering these tools can significantly boost your productivity and improve your site’s performance.
But what exactly makes Chrome Developer Tools so essential for web developers? Can they truly transform the way you approach coding and debugging? And how can you harness their full potential to create high-performing, SEO-friendly websites?
In this guide, we’ll see the myriad of features offered by Chrome Developer Tools, providing you with practical tips and tricks to elevate your web development game. Whether you’re a seasoned developer or just starting, these insights will help you navigate and utilize DevTools like a pro.
Introduction to chrome web developer tool
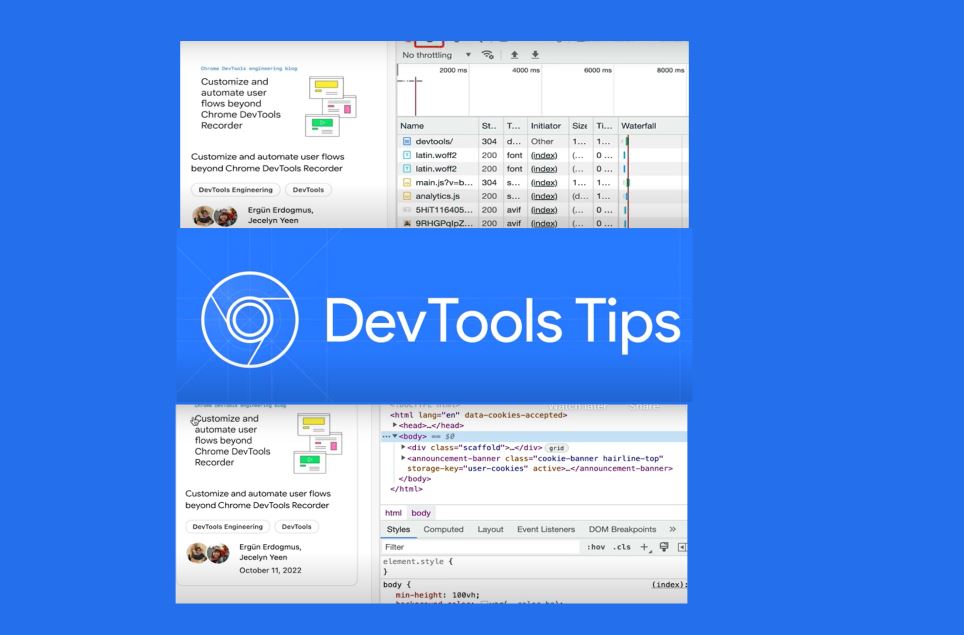
The internet is a constantly changing landscape, and as web developers, we need to adapt to new tools and technologies to keep up with industry standards. Google Chrome Developer Tools, commonly known as Chrome DevTools, are a set of web authoring and debugging tools built into the Google Chrome browser. They offer a robust platform for web developers to test, debug, and analyze their code directly within the browser, making the development process more efficient and effective.
What Are Chrome Developer Tools?
Chrome DevTools are an essential suite of tools for web developers, integrated directly into the Google Chrome browser. They provide various features that help developers inspect and debug HTML, CSS, and JavaScript, optimize website performance, and ensure a seamless user experience.
Why Are Chrome Developer Tools Important?
In the fast-paced world of web development, efficiency is key. Chrome DevTools allow developers to quickly identify and resolve issues, streamline workflows, and improve the overall quality of their websites. With these tools, you can:
- Debug JavaScript code and track down errors with ease.
- Inspect and edit HTML and CSS in real-time.
- Monitor network activity to optimize load times.
- Analyze performance to ensure your site runs smoothly.
- Simulate different device environments to test responsiveness.
Getting Started with Chrome Developer Tools
Opening DevTools
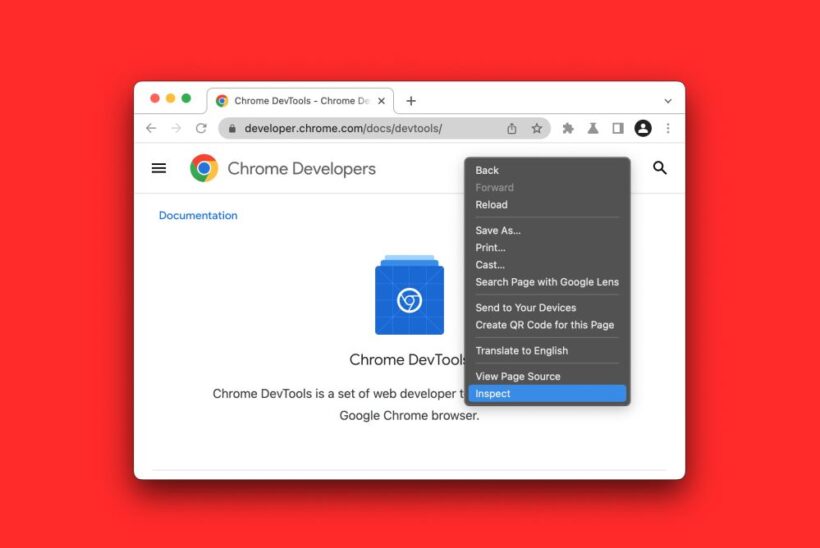
To start using Chrome DevTools, simply right-click on any web page element and select “Inspect,” or use the keyboard shortcut Ctrl+Shift+I (Windows) or Cmd+Opt+I (Mac). This will open the DevTools panel, revealing a wealth of features at your disposal.
The Elements Panel
The Elements panel is your go-to for inspecting and editing HTML and CSS. It allows you to see the structure of a webpage and make changes on the fly. Here are some tips for using the Elements panel:
- Inspecting Elements: Hover over elements in the Elements panel to highlight them on the webpage. This helps you see how HTML and CSS are applied.
- Editing HTML: Double-click on any HTML tag to edit it directly. This is useful for testing changes without modifying the actual source code.
- Modifying CSS: Click on any CSS property to change its value or add new properties. You can also toggle individual properties on and off to see their effects.
The Console Panel
The Console panel is a powerful tool for debugging JavaScript. It allows you to log messages, run JavaScript code, and view errors. Here are some tips for using the Console panel:
- Logging Messages: Use
console.log()to print messages to the Console. This is helpful for debugging and tracking variables. - Running JavaScript: You can type JavaScript code directly into the Console and execute it. This is great for testing small snippets of code.
- Viewing Errors: The Console automatically logs any errors or warnings that occur on the webpage. Click on the error messages to see more details and stack traces.
The Network Panel
The Network panel provides insights into all network requests made by your webpage. It helps you monitor and optimize load times, ensuring a fast and efficient user experience. Here are some tips for using the Network panel:
- Monitoring Requests: View all network requests and their details, including status, type, and time taken. This helps you identify slow-loading resources.
- Analyzing Performance: Use the waterfall chart to see how different resources load over time. Look for bottlenecks and optimize accordingly.
- Throttling: Simulate different network conditions, such as slow 3G or offline mode, to test how your site performs under various scenarios.
The Performance Panel
The Performance panel is designed to help you analyze your website’s performance and identify areas for improvement. Here are some tips for using the Performance panel:
- Recording Performance: Click the “Record” button to capture a performance profile of your webpage. This will provide a detailed breakdown of all activities, including rendering, scripting, and painting.
- Analyzing Frames: Look at individual frames to see how long each takes to render. Aim to keep frame times under 16ms for a smooth user experience.
- Identifying Bottlenecks: Use the flame chart to see which functions are taking the most time. Focus on optimizing these areas to improve overall performance.
The Application Panel
The Application panel gives you access to various web storage mechanisms, including cookies, local storage, and session storage. Here are some tips for using the Application panel:
- Viewing Cookies: Inspect all cookies set by your webpage, including their names, values, and expiration dates. This helps you manage and debug cookie-related issues.
- Managing Local Storage: View and edit local storage data directly from the panel. This is useful for testing changes to stored data without altering the source code.
- Inspecting Service Workers: See all registered service workers and their statuses. You can also update or unregister service workers as needed.
The Security Panel
The Security panel provides information about the security of your webpage, including HTTPS status and certificate details. Here are some tips for using the Security panel:
- Checking HTTPS: Ensure your site is served over HTTPS to protect user data and improve SEO. The Security panel will show any mixed content issues that need to be addressed.
- Viewing Certificates: Inspect the SSL certificate details to ensure they are valid and properly configured. Look for any warnings or errors that need to be resolved.
- Analyzing Security Issues: The panel highlights any security issues detected on your site. Address these issues promptly to maintain a secure browsing experience for your users.
Advanced Features and Tips
Mobile Emulation
Chrome DevTools allows you to emulate different devices to test your website’s responsiveness. Here are some tips for using mobile emulation:
- Selecting Devices: Use the device toolbar to choose from a range of pre-configured devices, or add custom devices as needed.
- Testing Touch Events: Enable touch emulation to simulate touch interactions, helping you test mobile-specific features and gestures.
- Adjusting Screen Sizes: Manually adjust the screen size and resolution to see how your site responds to different viewport sizes.
Lighthouse Audits
Lighthouse is an automated tool integrated into Chrome DevTools that provides audits for performance, accessibility, SEO, and more. Here are some tips for using Lighthouse:
- Running Audits: Click on the “Lighthouse” tab and select the categories you want to audit. Click “Generate report” to run the audit and view the results.
- Interpreting Results: Review the audit scores and recommendations to identify areas for improvement. Focus on the critical issues first to see the biggest impact.
- Implementing Changes: Follow the recommendations provided by Lighthouse to optimize your site. Re-run the audits after making changes to measure improvements.
Workspace Integration
Chrome DevTools allows you to integrate your development environment directly with the browser. Here are some tips for using workspace integration:
- Mapping Files: Map local files to network resources to enable live editing and save changes directly to your local files.
- Editing Styles: Use the Sources panel to edit CSS files and see the changes reflected in real-time. This streamlines the development workflow and reduces the need for manual file updates.
- Debugging JavaScript: Set breakpoints and step through code in the Sources panel to debug JavaScript effectively. This helps you identify and resolve issues faster.
End note on Chrome web developer tool
Chrome Developer Tools are an invaluable resource for web developers, offering a comprehensive suite of tools to debug, optimize, and enhance your websites. By mastering these tools, you can streamline your workflow, improve your site’s performance, and deliver a better user experience. Whether you’re inspecting elements, debugging JavaScript, analyzing network activity, or running performance audits, Chrome DevTools provides everything you need to elevate your web development game.
Remember, the key to becoming proficient with Chrome DevTools is practice. Experiment with different features, explore advanced capabilities, and continually refine your skills. As you become more comfortable with these tools, you’ll find yourself developing more efficient, high-performing websites that stand out in the crowded digital landscape.
So, the next time you’re faced with a tricky debugging challenge or looking to optimize your site for better performance, turn to Chrome Developer Tools. With the right knowledge and approach, you’ll be well-equipped to tackle any web development task with confidence and precision.
For more detailed tutorials and tips, be sure to check out the official Chrome Developer Tools documentation. Happy coding!
